
You are seeing a free-to-access but limited selection of the activity Altmetric has collected about this research output.
Click here to find out more.
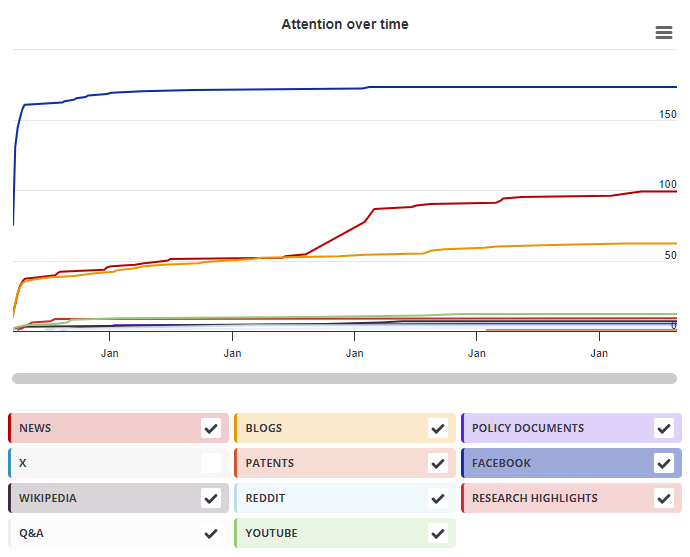
Timeline
X Demographics
Mendeley readers
| Title |
Distributed Computing and Artificial Intelligence
|
|---|---|
| Published by |
Springer Berlin Heidelberg, January 2012
|
| DOI | 10.1007/978-3-642-28765-7 |
| ISBNs |
978-3-64-228764-0, 978-3-64-228765-7
|
| Authors |
Debenham, JK, Simoff, SJ |
| Editors |
Sigeru Omatu, Juan F. De Paz Santana, Sara Rodríguez González, Jose M. Molina, Ana M. Bernardos, Juan M. Corchado Rodríguez |
X Demographics
The data shown below were collected from the profiles of 4 X users who shared this research output. Click here to find out more about how the information was compiled.
As of 1 July 2024, you may notice a temporary increase in the numbers of X profiles with Unknown location. Click here to learn more.
As of 1 July 2024, you may notice a temporary increase in the numbers of X profiles with Unknown location. Click here to learn more.
Geographical breakdown
| Country | Count | As % |
|---|---|---|
| United Kingdom | 2 | 50% |
| United States | 1 | 25% |
| Spain | 1 | 25% |
Demographic breakdown
| Type | Count | As % |
|---|---|---|
| Members of the public | 3 | 75% |
| Scientists | 1 | 25% |
Mendeley readers
The data shown below were compiled from readership statistics for 141 Mendeley readers of this research output. Click here to see the associated Mendeley record.
Geographical breakdown
| Country | Count | As % |
|---|---|---|
| Brazil | 4 | 3% |
| Finland | 2 | 1% |
| Spain | 2 | 1% |
| Portugal | 2 | 1% |
| Netherlands | 2 | 1% |
| Mexico | 1 | <1% |
| Morocco | 1 | <1% |
| Belgium | 1 | <1% |
| South Africa | 1 | <1% |
| Other | 4 | 3% |
| Unknown | 121 | 86% |
Demographic breakdown
| Readers by professional status | Count | As % |
|---|---|---|
| Student > Master | 35 | 25% |
| Student > Ph. D. Student | 34 | 24% |
| Student > Bachelor | 20 | 14% |
| Researcher | 14 | 10% |
| Student > Doctoral Student | 7 | 5% |
| Other | 31 | 22% |
| Readers by discipline | Count | As % |
|---|---|---|
| Computer Science | 80 | 57% |
| Engineering | 19 | 13% |
| Unspecified | 15 | 11% |
| Business, Management and Accounting | 8 | 6% |
| Agricultural and Biological Sciences | 5 | 4% |
| Other | 14 | 10% |