
You are seeing a free-to-access but limited selection of the activity Altmetric has collected about this research output.
Click here to find out more.
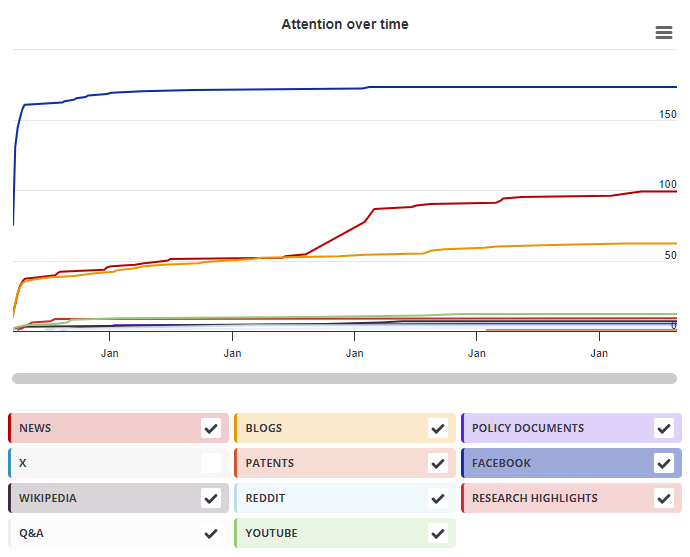
Timeline
Mendeley readers
| Chapter title |
Drawings as Research Method
|
|---|---|
| Chapter number | 2 |
| Book title |
Picturing Research
|
| Published by |
SensePublishers, January 2011
|
| DOI | 10.1007/978-94-6091-596-3_2 |
| Book ISBNs |
978-9-46-091596-3
|
| Authors |
Claudia Mitchell, Linda Theron, Jean Stuart, Ann Smith, Zachariah Campbell, Mitchell, Claudia, Theron, Linda, Stuart, Jean, Smith, Ann, Campbell, Zachariah |
Mendeley readers
The data shown below were compiled from readership statistics for 91 Mendeley readers of this research output. Click here to see the associated Mendeley record.
Geographical breakdown
| Country | Count | As % |
|---|---|---|
| Iran, Islamic Republic of | 1 | 1% |
| South Africa | 1 | 1% |
| Unknown | 89 | 98% |
Demographic breakdown
| Readers by professional status | Count | As % |
|---|---|---|
| Student > Master | 27 | 30% |
| Student > Ph. D. Student | 24 | 26% |
| Student > Bachelor | 6 | 7% |
| Researcher | 6 | 7% |
| Student > Doctoral Student | 4 | 4% |
| Other | 13 | 14% |
| Unknown | 11 | 12% |
| Readers by discipline | Count | As % |
|---|---|---|
| Social Sciences | 32 | 35% |
| Arts and Humanities | 12 | 13% |
| Design | 8 | 9% |
| Psychology | 7 | 8% |
| Nursing and Health Professions | 3 | 3% |
| Other | 13 | 14% |
| Unknown | 16 | 18% |