
You are seeing a free-to-access but limited selection of the activity Altmetric has collected about this research output.
Click here to find out more.
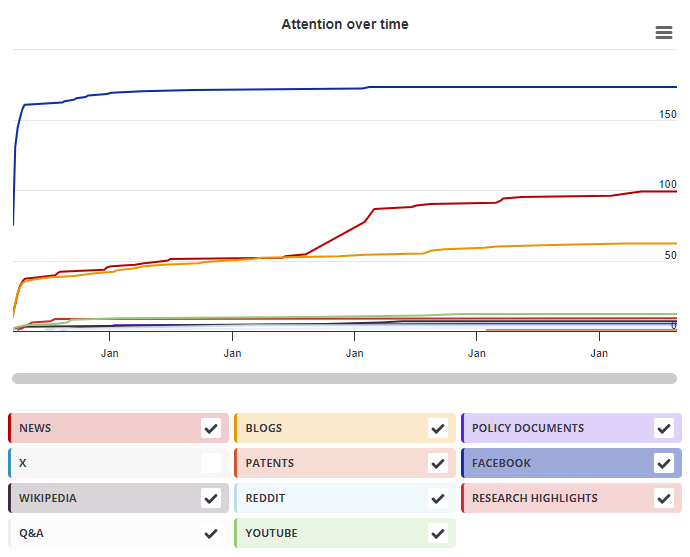
Timeline
Mendeley readers
| Chapter title |
Artistic Data Visualization: Beyond Visual Analytics
|
|---|---|
| Chapter number | 21 |
| Book title |
Online Communities and Social Computing
|
| Published by |
Springer, Berlin, Heidelberg, July 2007
|
| DOI | 10.1007/978-3-540-73257-0_21 |
| Book ISBNs |
978-3-54-073256-3, 978-3-54-073257-0
|
| Authors |
Fernanda B. Viégas, Martin Wattenberg, Viégas, Fernanda B., Wattenberg, Martin |
Mendeley readers
The data shown below were compiled from readership statistics for 220 Mendeley readers of this research output. Click here to see the associated Mendeley record.
Geographical breakdown
| Country | Count | As % |
|---|---|---|
| United States | 10 | 5% |
| Germany | 3 | 1% |
| Canada | 3 | 1% |
| United Kingdom | 3 | 1% |
| Portugal | 2 | <1% |
| France | 2 | <1% |
| Malaysia | 1 | <1% |
| Switzerland | 1 | <1% |
| South Africa | 1 | <1% |
| Other | 6 | 3% |
| Unknown | 188 | 85% |
Demographic breakdown
| Readers by professional status | Count | As % |
|---|---|---|
| Student > Ph. D. Student | 52 | 24% |
| Student > Master | 46 | 21% |
| Researcher | 30 | 14% |
| Student > Bachelor | 23 | 10% |
| Student > Postgraduate | 9 | 4% |
| Other | 30 | 14% |
| Unknown | 30 | 14% |
| Readers by discipline | Count | As % |
|---|---|---|
| Computer Science | 88 | 40% |
| Design | 33 | 15% |
| Arts and Humanities | 27 | 12% |
| Social Sciences | 12 | 5% |
| Engineering | 10 | 5% |
| Other | 17 | 8% |
| Unknown | 33 | 15% |